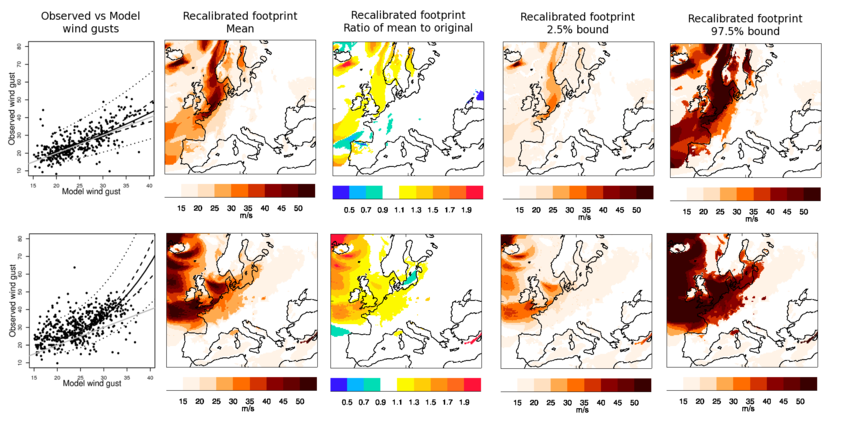
This section introduces a statistical method for `recalibrating' wind storm footprints, where recalibration describes deriving the true distribution of wind gust speeds, given MetUM model output. The proposed method is based on polynomial regression between transformed gust speeds: the response variable represents station observations and the explanatory variable MetUM model output. All data within the footprint's domain are used, ranging between storms from 154 to 1,224 stations, depending on data availability. Gust speeds above 20ms-1 are recalibrated. Where MetUM model gust speeds do not exceed 20ms-1, the recalibrated footprint uses the original MetUM model output. By assuming that the observations are representative of the true gust speeds, the regression relationship gives the distribution of true gust speeds given the MetUM model's output.
A random effects model (Pinheiro and Bates, 2000) is used to allow multiple wind storm footprints to be recalibrated simultaneously, which is achieved by associating a separate random effect with each storm. This model is based on an underling polynomial relationship between observed and MetUM-model-simulated gust speeds, from which storm-specific relationships deviate according to some distributional assumptions and location-specific covariates. The random effects capture unmodelled differences between storms, one example being whether a storm is a sting jet or not. Not only does this allow a specific storm's footprint to be recalibrated, but storms without observational data can too, by integrating out the random effects, though this latter feature is not utilised here.
Note that as new storms are added to the catalogue, the additional observational data will affect the recalibration of the original 50 storms. This effect is minimal, however, so the original 50 recalibrated footprints will not be updated.
The notation adopted is that Yj(s) is the observed maximum gust speed for storm j, j=1, ......, J, location s with gust speed data, and Xj(s) is the corresponding MetUM model output, noting that only Xj(s)>20ms-1 are modelled. Gust speeds are log-transformed. The random effects model then has the formulation
|
log Yj(j) ~ N(mj (log Xj(s),z(s)), σ2) |
(1) |
where z(s) is a vector of known covariates for location s, σ2 is a variance parameter, and the mean has linear form.
mj(log Xj(s), z(s)),σ2) = Σ2k=0 (βk+bj,k+zT(s) (γk+cj,k)) {log Xj(s)}k
where (bj,0, bj,1, bj,2)T ~ MVN((0, 0, 0)T, Σb) (cj,0, cj,1, cj,2)T ~ MVN((0 ...... 0)T, Σc), β0, β1, β2, γ0, γ1 and γ2 are regression coefficients and Σb and Σc are covariance matrices. Maximum likelihood is used to estimate θ=(β0, β1, β2, γ0, γ1, γ1, σ2, Σb, Σγ).
Let zT(s) = (elevation(s), lon(s), lat(s), lon(s):lat(s)) (where lon(s) and lat(s) represent standardised longitudes and latitudes with mean zero and unit variance, respectively), so that γk = (γelev, k, γlon,k, γlat,k, γlon:lat,k)T for k=0, 1, 2. This formulation allows the mean relationship to vary with elevation and location in a sufficiently robust way. The figure below shows the resulting recalibrated footprints for the Great Storm of '87 (aka 87J) and Daria (aka Burns' Day Storm). Column 1 of the figure shows that the recalibrated gust speeds are more consistent with the observations than originally simulated by the MetUM model, which are in general negatively biased (column 3), though predictions are accompanied by relatively large uncertainty (prediction intervals, column 1; columns 4 and 5). The recalibrated footprints, however, accurately quantify the true gust speeds, given the MetUM model's output.

Recalibrated footprints for The Great Storm of
'87 (row 1) and Daria (row 2). Column 1 shows observed vs. MetUM
model maximum wind gust speeds for storm duration with recalibrated
mean (-----), 95% confidence ( - - - ) and 95% prediction
(⋅⋅⋅⋅)
intervals based on London and y=x (grey) superimposed.
Column 2 shows the mean recalibrated footprint, column 3 its ratio
to the original footprint and columns 4 and 5 2.5% and 97.5%
prediction bounds, respectively.
Licensing: The data provided on this site can be used for research and commercial purposes under the Creative Commons CC BY 4.0 International Licence: http://creativecommons.org/licenses/by/4.0/deed.en_GB. The following citation should be used for the XWS Datasets: (c) Copyright Met Office, University of Reading and University of Exeter. Licensed under Creative Commons CC BY 4.0 International Licence: http://creativecommons.org/licenses/by/4.0/deed.en_GB.
Disclaimer: The organisations involved give no warranty as to the quality or accuracy of the information on this website or its suitability for any use. Your use of information provided by this website is at your own risk.