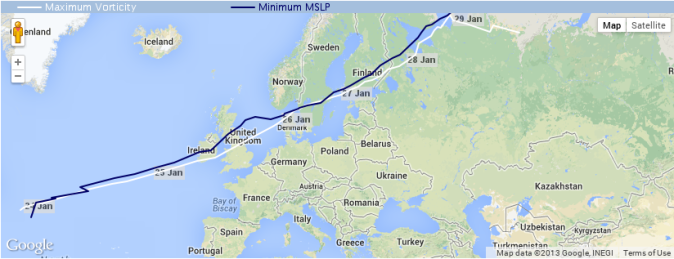
In this release of XWS, storms are tracked from the ERA-Interim data set (Dee et al. 2011), over 34 extended winters (October - March 1979/80 - 2012/13). The identification and tracking of the cyclones is performed following the approach used in Hoskins & Hodges (2002) based on the Hodges (1995, 1999) tracking algorithm. This uses relative vorticity at 850hPa to identify and track the cyclones. In past studies (Hodges et al., 2011) this approach has used 6 hourly re-analysis data but here, because of the very fast propagation speeds that are often encountered with extreme wind storms and the need to obtain their motion as accurately as possible, we make use of 3 hourly ERA Interim data. The 3 hourly data is obtained for ERA Interim by splicing the 3 hour forecast in between the 6 hourly analyses. Before the identification and tracking progresses the data are smoothed to T42 (approximately 2.8 degree resolution), and the large scale background removed as described in Hoskins & Hodges (2002), this reduces the inherent noisiness of the vorticity and makes the tracking more reliable for synoptic scale storms. The cyclones are identified by determining the off-grid vorticity maxima in the filtered data as described in Hodges (1995). A threshold of 1.0x10⁻⁵s-1 is applied so that only relative vorticty maxima above this value are considered. The maxima are linked together, initially using a nearest neighbour search, and then refined by minimizing a cost function for track smoothness subject to constraints on the displacement distance and track smoothness (Hodges 1999). These constraints have been modified from those used for 6 hourly data to be suitable for the 3 hourly data. Features that last for shorter than 2 days are not considered.
Since we are only interested in severe European storms, only storms which enter the domain defined by 15W to 25E, 35N to 70N are considered for the catalogue. This leaves 5730 storms over the 33 extended winters.
The format of the track data is described in the Data description page.

Licensing: The data provided on this site can be used for research and commercial purposes under the Creative Commons CC BY 4.0 International Licence: http://creativecommons.org/licenses/by/4.0/deed.en_GB. The following citation should be used for the XWS Datasets: (c) Copyright Met Office, University of Reading and University of Exeter. Licensed under Creative Commons CC BY 4.0 International Licence: http://creativecommons.org/licenses/by/4.0/deed.en_GB.
Disclaimer: The organisations involved give no warranty as to the quality or accuracy of the information on this website or its suitability for any use. Your use of information provided by this website is at your own risk.