All the sections are taken from only two storms, Daria (Burns' Day storm) and Lothar. Use the navigation below to switch to a standard comparison between two storms.
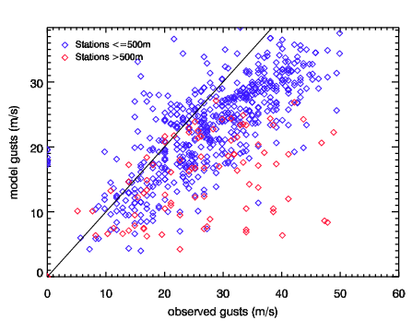
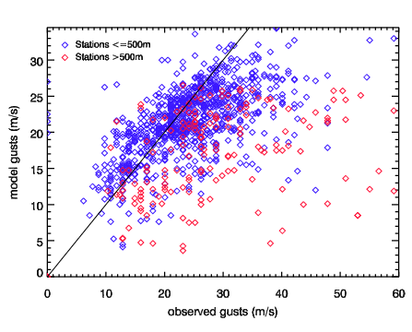
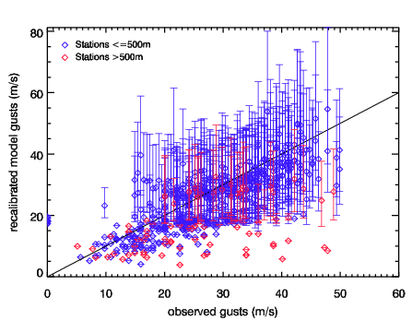
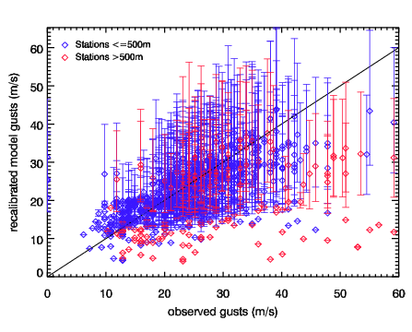
The sections below show: 1) details for Daria (Burns' Day storm) and statistics; 2) details for Lothar and statistics; 3) gust speed animation for Daria (Burns' Day storm) showing the track and instantaneous 3-second gusts at 3 hour intervals over a 72 hour period; 4) gust speed animation for Lothar showing the track and instantaneous 3-second gusts at 3 hour intervals over a 72 hour period; 5) storm tracks for Daria (Burns' Day storm) showing the maximum in vorticity for each storm, while labels on the maximum relative vorticity path indicate the start of that day; 6) raw footprint for Daria (Burns' Day storm) is described in Storm footprints; 7) raw footprint for Lothar is described in Storm footprints; 8) uncontaminated raw footprint for Daria (Burns' Day storm) only includes gusts local to the storm (as described on Storm footprints); 9) uncontaminated raw footprint for Lothar only includes gusts local to the storm (as described on Storm footprints); 10) observational footprint for Daria (Burns' Day storm) from MIDAS database; 11) observational footprint for Lothar from MIDAS database; 12) recalibrated lower 95% bound for Daria (Burns' Day storm) is described in Recalibration of final storm footprints; 13) recalibrated lower 95% bound for Lothar is described in Recalibration of final storm footprints; 14) recalibrated mean for Daria (Burns' Day storm) is described in Recalibration of final storm footprints; 15) recalibrated mean for Lothar is described in Recalibration of final storm footprints; 16) recalibrated upper 95% bound for Daria (Burns' Day storm) is described in Recalibration of final storm footprints; 17) recalibrated upper 95% bound for Lothar is described in Recalibration of final storm footprints; 18) raw models gusts versus observed gusts for Daria (Burns' Day storm) is described in Comparison of model footprints to station data; 19) raw models gusts versus observed gusts for Lothar is described in Comparison of model footprints to station data; 20) recalibrated models gusts versus observed gusts for Daria (Burns' Day storm) showing the 95% bounds as error bars; 21) recalibrated models gusts versus observed gusts for Lothar showing the 95% bounds as error bars. Where data is available, links are provided under figure.
| Aliases: | Burns' Day storm | |
| Damage: | 8.2bn | |
| Countries affected: | Belgium, France, Germany, Netherlands and United Kingdom | |
| Storm duration: | 21:00 23 January - 12:00 29 January 1990 | |
| Maximum 925 hPa wind speed over land from ERA Interim re-analysis (Umax): | 37.92ms-1 | |
| Date Umax: | 25 January 1990 | |
| Sft (rank of storm): | 48.05e06 (6) | |
| N: | 881 | |
| Maximum relative vorticity at 850hPa from ERA-Iterim reanalysis (ζmax): | 1.19e-04s-1 | |
| Date of ζmax: | 15:00 25 January 1990 | |
| Location of ζmax: | (0.5E, 54.4N) | |
| Minimum mean sea level pressure from ERA-Interim reanalysis: | 948.6hPa | |
| Date of min MSLP: | 21:00 25 January 1990 | |
| Location of min MSLP: | (2.1E, 57.2N) | |
| Related links: | Wikipedia |
| Damage: | 8.0bn | |
| Countries affected: | France, Germany and Switzerland | |
| Storm duration: | 21:00 23 December - 0:00 28 December 1999 | |
| Maximum 925 hPa wind speed over land from ERA Interim re-analysis (Umax): | 36.72ms-1 | |
| Date Umax: | 26 December 1999 | |
| Sft (rank of storm): | 18.82e06 (30) | |
| N: | 380 | |
| Maximum relative vorticity at 850hPa from ERA-Iterim reanalysis (ζmax): | 6.43e-05s-1 | |
| Date of ζmax: | 3:00 26 December 1999 | |
| Location of ζmax: | (4.3W, 48.9N) | |
| Minimum mean sea level pressure from ERA-Interim reanalysis: | 973.2hPa | |
| Date of min MSLP: | 9:00 26 December 1999 | |
| Location of min MSLP: | (5.1E, 49.7N) | |
| Related links: | Wikipedia and BBC |
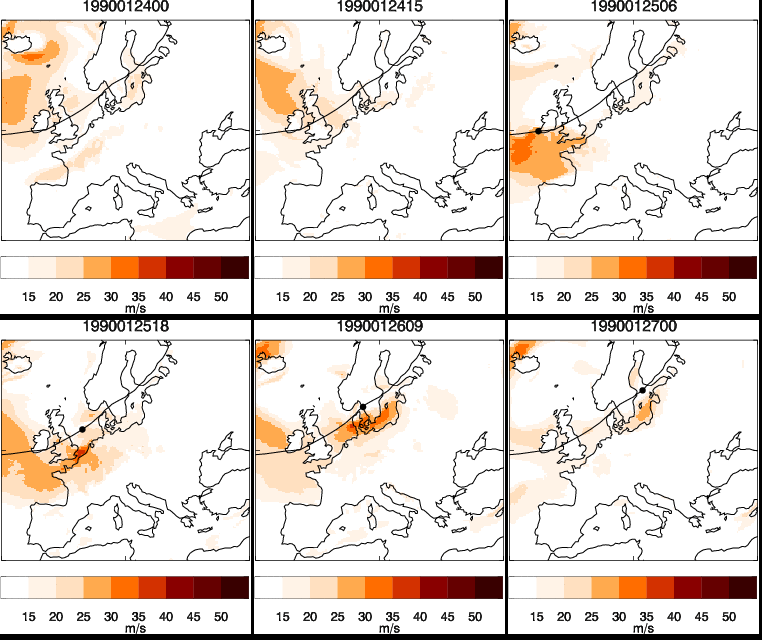
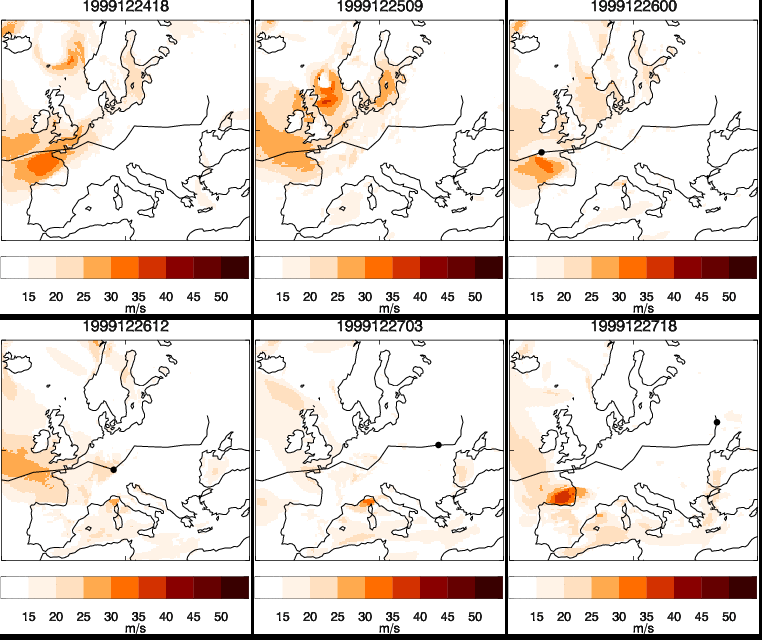
| Daria (Burns' Day storm) |
| Lothar |
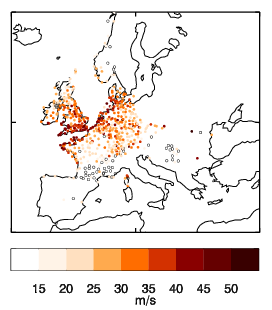
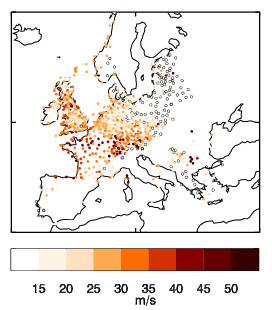
Licensing: The data provided on this site can be used for research and commercial purposes under the Creative Commons CC BY 4.0 International Licence: http://creativecommons.org/licenses/by/4.0/deed.en_GB. The following citation should be used for the XWS Datasets: (c) Copyright Met Office, University of Reading and University of Exeter. Licensed under Creative Commons CC BY 4.0 International Licence: http://creativecommons.org/licenses/by/4.0/deed.en_GB.
Disclaimer: The organisations involved give no warranty as to the quality or accuracy of the information on this website or its suitability for any use. Your use of information provided by this website is at your own risk.